


A Walkthrough The Data Science Project
What does make a typical data science project?
 Photo by Carlos Muza on Unsplash
This article was originally posted on Medium, same author, the same goal of sharing through writing.
Welcome to this intuitive article about data science project journey. I will talk about the most and necessary parts of approaching any data science problem. In some parts, I will also include most techniques which are likely to be used.
Data Science is a very broad field, but things seem to make sense when we are working on projects that we are interested in having the idea of what each step looks like to have the final product.
That being said, any data science project will have
- Introduction. Which business question to answer?
- Exploratory Data Analysis
- Data Cleaning
- Data Preprocessing
- Creating a model
- Evaluating a model
- Improving the model
- Putting a product into use
While we are going to talk about each part, there is no strict arrangement of what it should look like. It all depends on the question we want to solve, the dataset we have(we may not need data cleaning because it is already clean), and what final result we want. For example, If we are only answering how many people bought product X in April, we may not need Machine learning.
Introduction
Pretty much everything starts and ends somewhere. This is no different from the data science project.
This is where we clearly show the question that our analysis is intended to solve, and the important metrics to be judged on.
Once we know the purpose of our analysis or question we are answering, this is a time to start gathering the relevant data. We can search for the data by going to sites like Kaggle, government sites, scraping websites, or could be directly from your organization. Do read the license though, good data scientist considers privacy before using datasets or scraping the data.
We have got a question to solve, data to use, and now is setting up our workspace. Depending on the scope of the analysis, we will probably choose certain workspaces than others. One may choose to do visualizations in software like Tableau, or Jupyter notebook to leverages the power of various data science libraries or IDE (Integrated Development Environment such as PyCharm or Atom.
The first step to work with data is loading it into the workspace. As an example, you will use common data manipulation tools such as Pandas, and depending on your data formats such as CSV, excel, or pdf. And anything we do here isn’t changing the data, it is just more about understanding what makes it.
Exploratory Data Analysis (EDA)
 Photo by Luke Chesser on Unsplash
EDA is the most important statistical part of the data science work. Without me saying more, Wikipedia defines EDA as:
In statistics, exploratory data analysis (EDA) is an approach to analyzing data sets to summarize their main characteristics, often with visual methods. A statistical model can be used or not, but primarily EDA is for seeing what the data can tell us beyond the formal modelling or hypothesis testing task.
Here, we are trying to understand different features by making plots or charts, kind of trying to find a story in data. We can do data manipulation techniques such as grouping to make sense of these features using visual plots.
Data Cleaning
Data cleaning is often confused with data preprocessing (data preprocessing means data is already processed except that there is further processing for Machine Learning model).
We have understood the data, and we found there are:
- Missing values
- Features which doesn’t make sense
- A date that we need to separate into a standard date-time object
- And a categorical feature that we want to separate
Depending on what we got in these scenarios, we will take actions of cleaning. If we are dealing with missing data, we normally have three options which are:
- Leaving the missing data
- Filling the missing data with the zero, mean or median
- And dropping the missing data
As it is easy saying to drop missing data, we will consider its size over the whole dataset because once we did it, it may take time to go back to make changes.
Now we have taken all these actions, and the data is clean. Breath a bit and give yourself another cup of coffee because dealing with messy data takes a big percentage of time spent working on a data science project.
 Photo by Jeremy Perkins on Unsplash
Data Preprocessing
We have clean data, and now we’re thinking about the machine learning model.
Data preprocessing involves dealing with clean data for further processing to fit the data into the model.
If the data was not originally split into training and test sets, this is the time to do it. Usually, the training set is 70% of the data, and the test set is 30%. After this step, you will make sure that the data is in the right format for achieving good performance. Machine learning model will achieve good performance if the training and testing data are scaled to a small range of values, typical between 0 and 1.
To achieve scaling data, techniques of Standard Scaler or MinMax Scaler (When using sklearn) are used. You do not need to fit the testing data, only scale it to these small ranges of values.
Do not now worry about these terms if they are not familiar yet, now know they exist.
Choosing and Creating Machine Learning model
We have clean and preprocessed data, and this is the time to think about the machine learning model that best suits our question. The model sounds magic, right? Well, it can be!!
Depending on these two things (our task and data we have), we are going to have different options in choosing a machine learning algorithm. Usually, machine learning algorithms falls under the following types:
- Supervised learning: This model takes a set of inputs variables and maps it to the target outputs to learn predicting on unseen data. The common algorithms used in this type are linear regression, logistic regression, random forest, and decision tree.
- Unsupervised learning: In this type, we don’t have the target output. We just feed the unlabeled data to the model and let a model find a sense in the data. This is usually the case where the output of the model is clusters or groups of customers as an example.
Without taking long here, let us review the 3 common machine learning models.
- Regression: This is a supervised learning model which is known for predicting or estimating continuous variables. The common example is estimating house price given the details of such house (size, no of bedrooms,…). Most used algorithms used here are Linear Regression, Random Forest and Support Vector Regression(SVR).
- Classification: This is a supervised learning model which is the best choice for tasks that have two or more classes of the label. The output is a probability of either 1 or 0. For instance, imagine if you are asked to make an application that accepts images of cats and dogs, and predict whether the entered image is cat or dog. One entered image has to either be a cat or dog. Most algorithms are Support Vector machines, Random forest classifier and decision tree.
- Clustering: This is an unsupervised learning model which groups similar objects into clusters or groups. The most known algorithm in clustering problems is K-means(a k number of clusters are formed). Clustering is used in customer segmentation as an instance.
I use not to worry much about machine learning model because as said it takes around 10% of the project. You can try different models, and choose one which gives the highest accuracy on testing data. Also, 90% of machine learning problems will be solved by simple models such as linear or logistic regression without the need for fancy models.
While we have put much focus on common algorithms, you can expand your experimentation by using Deep Learning which uses artificial neural networks. The choice here would be TensorFlow or Pytorch. I prefer TensorFlow due to its simplicity when it comes to building and testing a model, but for someone who would like much control, Pytorch can be a good option.
Evaluating a model
Let us say we have chosen the best algorithm over all models we tried, trained it on train data, and predicted it on test data. And now is the time to evaluate the model. How do we know that our model is working well?
While achieving an accuracy of 98% is good, that doesn’t mean that the model is going to make cutting edge predictions. There are much more to consider. For example, accuracy may not be the best performance metric for classification tasks. For more on evaluation metrics, I have found this article by Kartik Nighania helpful.
Improving the model
Trained the model, and let’s say we got 90%. And said, “well, this isn’t enough. I need to increase accuracy”. This is possible by using the following practices:
- Look for more data.
- Try multiple machine learning algorithms.
- Try advanced techniques such as searching the best hyper-parameters (GridSearch) and cross-validation)
- Try to understand the data by doing visualizations to help you understand the important features to be kept or meaningless features to be dropped off.
- Do further cleaning on the dataset by taking the right actions on missing value. As a reminder, missing value can either be filled, removed, or neglected. Also, look for categorical features that can be categorized.
Lastly, have a limit on the accuracy that you want and be careful about how many times you iterate through training set to avoid overfitting.
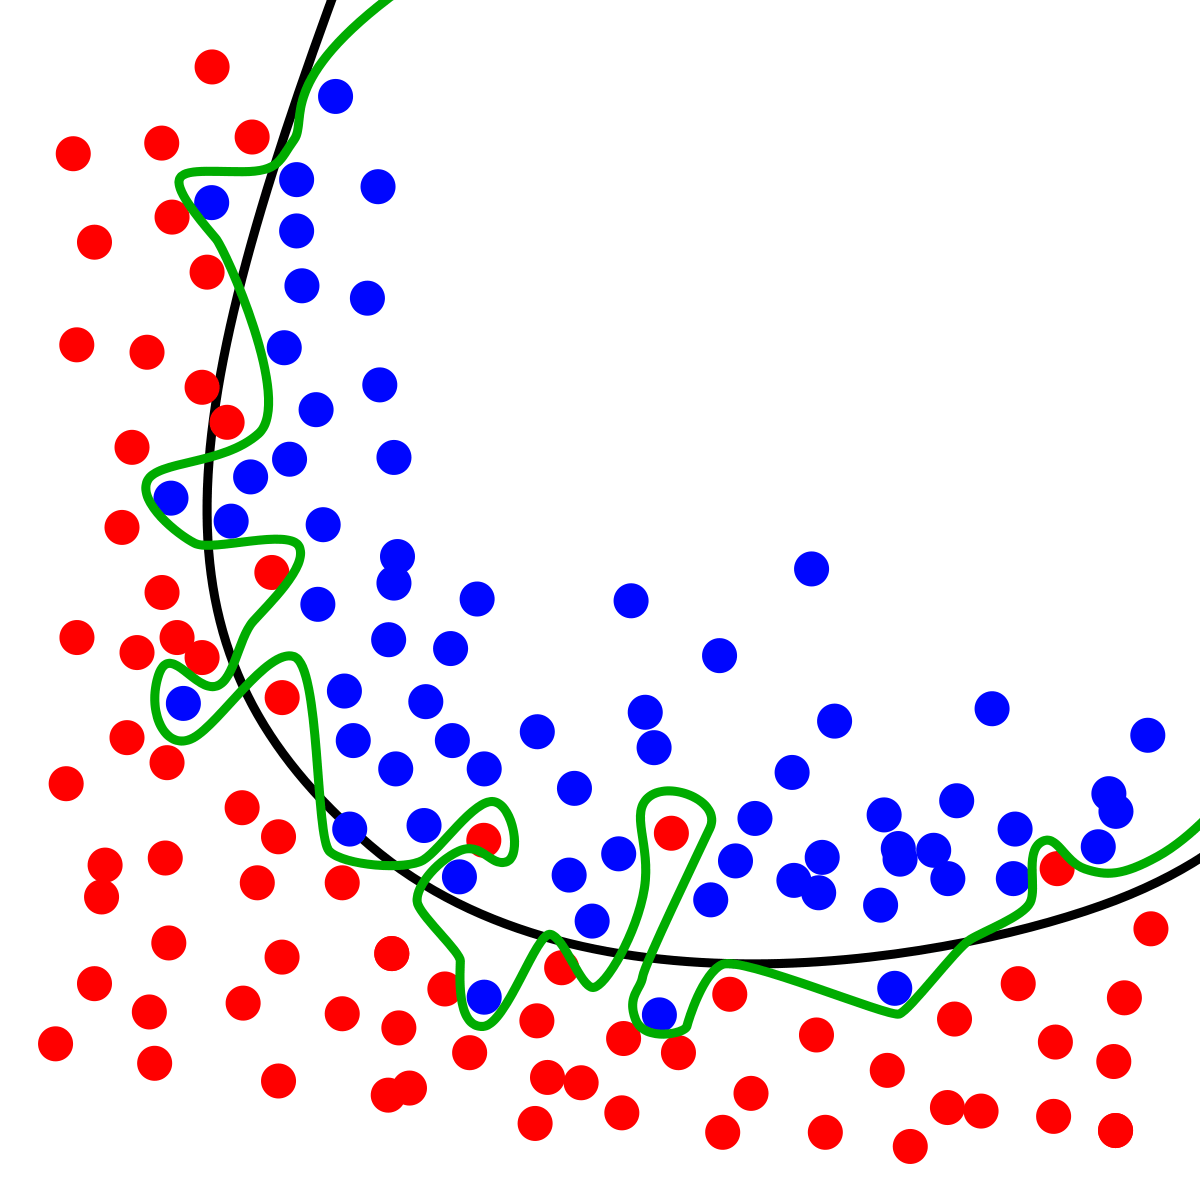
From the visualization above, the green line shows that the overfitted model and the black line shows the regularized model.
Putting a project into use (Deploying)
After all, what matter is that our work is used by the end-users who often don’t understand all these steps we went through. I found this guide by Maarten Grootendorst very helpful on how to deploying Machine learning model.
Conclusion
To wrap this up, data science project starts with a question or idea, gathering the data, exploring and cleaning the data, choosing the right machine learning model, evaluating the results, and putting the project into use by both techies and non-techies.
Thank you for reading!
If you want to see my recent works which motivated me to write this article, please check the notebook with codes on GitHub repository here. You could also find some interesting folks there!
Connect with me on LinkedIn and Twitter here.