The Difference Between Model Performance Metrics and User Satisfaction Metrics
I am currently taking Machine Learning Engineering Operations specialization by DeepLearning.AI.
It's a great course that teaches how to build effective learning systems, building efficient data cleaning and modeling pipelines, and deploying machine learning models (on the device and on the cloud).
I am currently on the fourth course, Deploying Machine Learning Models in Production, and I have recently learned the difference between model optimizations metrics and satisfaction metrics. I want to share that with you.
What are Model Optimization Metrics?
The next step after training a model is to evaluate how it can perform on new data. The ability of the model to do well on new data tells how good it is or its generalization capability.
Model optimization metrics or evaluation metrics are what tells the model generalization ability. The right choice of metric depends on the problem.
Regression Metrics
For regression problems or problems that involve predicting the continuous values, the popular metrics are mean squared error or mean absolute error.
Simply, the error is the difference between predictions and actual output. Mean squared error is the mean of the squared errors, and mean absolute error is the mean of the absolute of the errors.
Classification Metrics
For classification problems where the goal is to predict the class or category, the metrics can be accuracy, precision, recall, and F1 score.
Accuracy is the commonly used metric in classification problems. It tells how accurate the model is at making correct predictions. Take an example: If your classifier can only recognize 95 images in 100 images, the accuracy is 95%. Accuracy is not an appropriate metric when the dataset is not balanced.
Precision and recall are two metrics that are used when the dataset is skewed, or when the number of samples in classes is not balanced.
Precision shows the percentage of the positive predictions that are actually positive. To quote Google ML Crash Course, precision answer the following question: What proportion of positive identifications was actually correct?
The recall on the other hand shows the percentage of the actual positive samples that were classified correctly. It answers this question: What proportion of actual positives was identified correctly?
There is a tradeoff between precision and recall. Often, increasing precision will decrease recall and vice versa. To simplify things, we combine both of these two metrics into a single metric called the F1 score.
F1 score is the harmonic mean of precision and recall, and it shows how good the model is at classifying all classes without having to balance between precision and recall. If either precision or recall is very low, the F1 score is going to be low too.
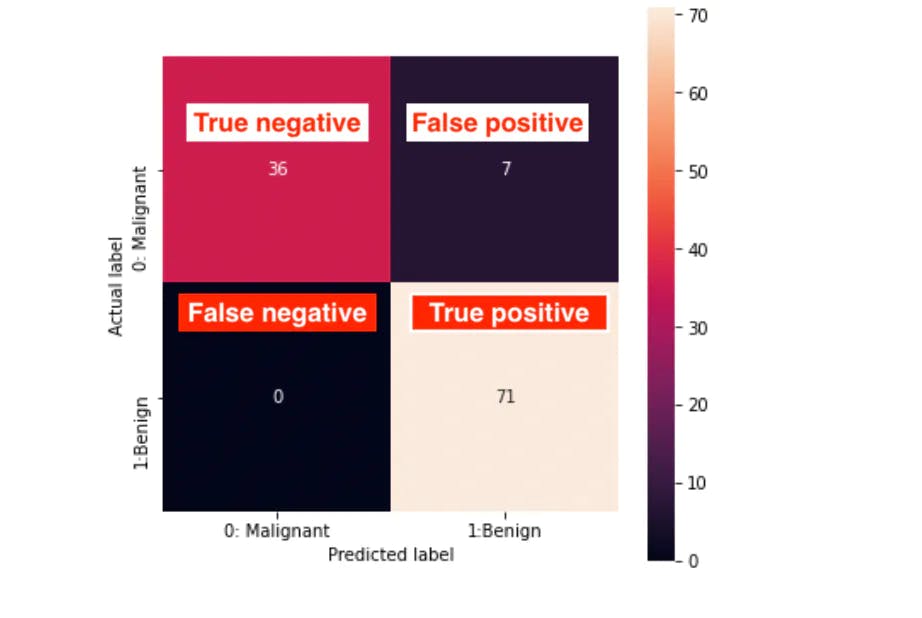
Both accuracy, precision, and recall can be calculated easily by using a confusion matrix. A confusion matrix shows the number of correct and incorrect predictions made by a classifier in all available classes.
More intuitively, a confusion matrix is made of 4 main elements: True negatives, false negatives, true positives, and false positives.
True Positives(TP): Number of samples that are correctly classified as positive, and their actual label is positive.
False Positives (FP): Number of samples that are incorrectly classified as positive, when in fact their actual label is negative.
True Negatives (TN): Number of samples that are correctly classified as negative, and their actual label is negative.
False Negatives (FN): Number of samples that are incorrectly classified as negative, when in fact their actual label is positive.

So, if we take the above confusion matrix as an example:
- Accuracy =
(TP + TN) / (TP + TN + FP + FN) = (71 +36)/(71+36+7+0) = 0.93 or 93% - Precision =
TP / (TP + FP) = 71/(71+7) =0.91 or 91% - Recall =
TP / (TP + FN) = 71/(71+0) = 1, or 100% - F1 score =
2PR / (P + R) = 2x0.91x1/(0.91+1) = 0.95, or 95%
A classifier that doesn't have false positives has a precision of 1, and a classifier that doesn't have false negatives has a recall of 1. Ideally, a perfect classifier will have the precision and recall of 1.
We can increase the precision by reducing the false positives and increase recall by reducing the false negatives. But it's important to note that increasing one can reduce the other.
The ultimate goal of building a learning system is to maximize the performance metrics. It's a signal that the model will do well when deployed in production.
However, though, increasing these model metrics is not always enough especially when we are to deploy the model into production. The users won't care much about seeing that the request they made came with 99% accuracy, but they may care much about how long it took to get what they asked.
Let's talk about user-centered metrics.
More Metrics: User Satisfaction Metrics
Getting a classifier that gives 99% accuracy is great, but it is one side of the equation. The users are more interested in how fast they can get what they want.
Satisfaction metrics are the kinds of metrics that can influence the user's attitudes when interacting with the (machine learning) application. Quoting Wikipedia on the definition of user satisfaction:
Doll and Torkzadeh's (1988) definition of user satisfaction is the opinion of the user about a specific computer application, which they use.
And
According to key scholars such as DeLone and McLean (2002), user satisfaction is a key measure of computer system success, if not synonymous with it.
There are 3 main satisfaction metrics: latency, throughput, and model size that determine the cost. Let's talk about them.
Latency
Latency is a term that is used in different tech stacks such as communication and network systems. The precise meaning of latency depends on the context but as we are talking about machine learning systems and user requests, let's bend it there.
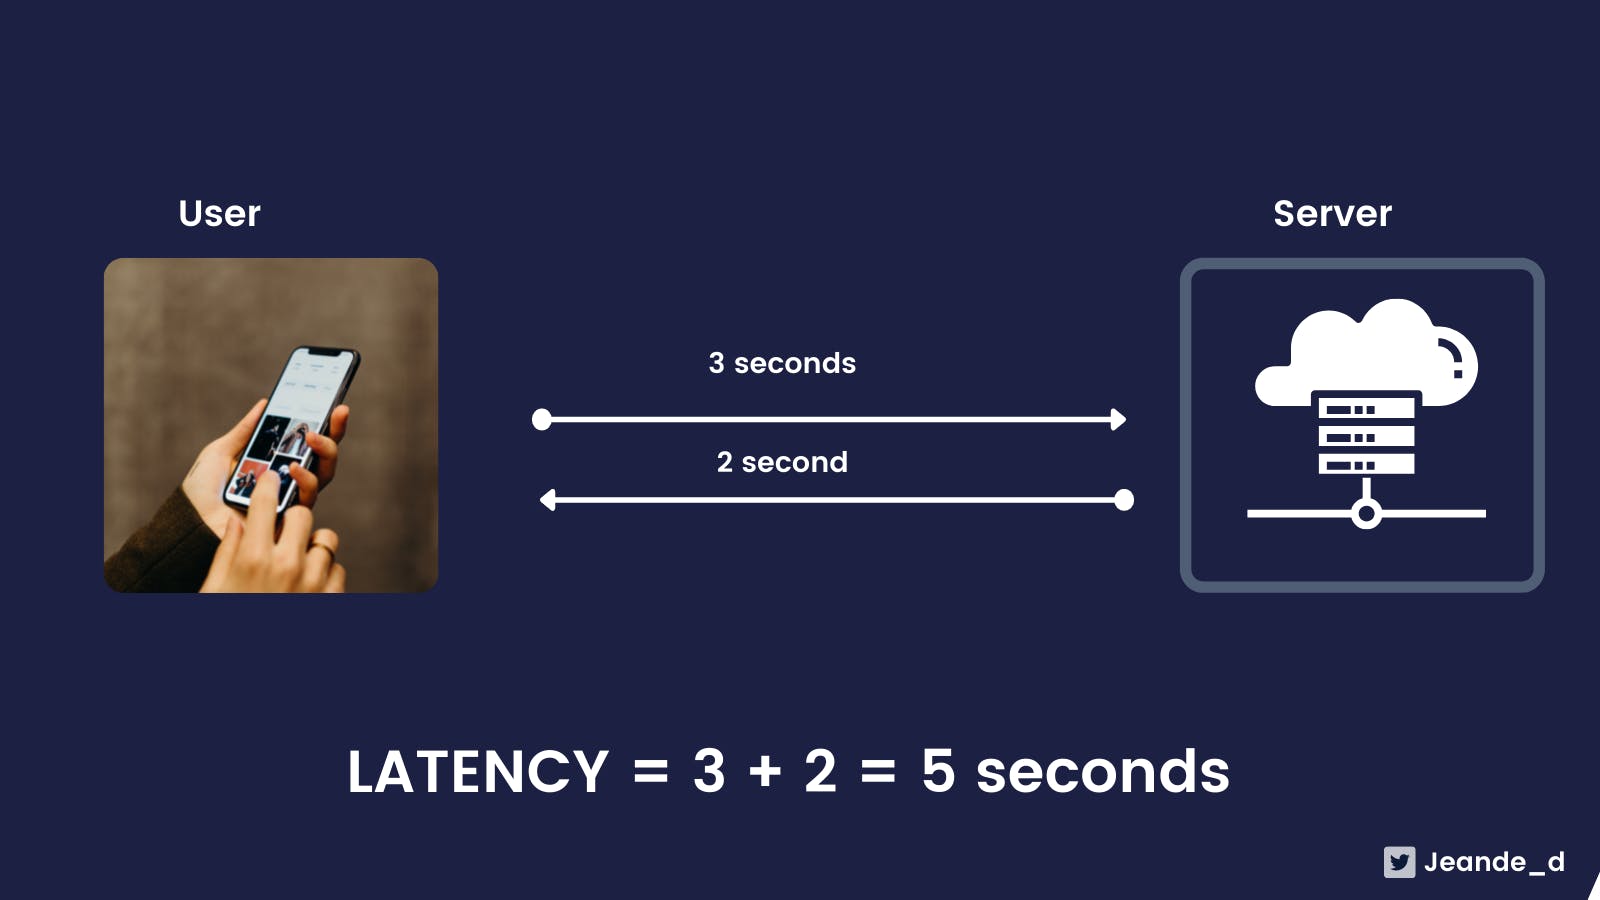
Latency is the total delay between the time the user made a request to the served model and the time that she/he got the response. It includes the time it takes to send the data to the server, preprocessing user data, running inference on the data, and returning the response back to the user.
If you are anything like me, you would want to get your requests as soon as possible. Minimizing the latency is the key requirement to maintaining customer satisfaction. The Wikipedia page that we quoted earlier also stated that successful organizations have systems in place which they believe help maximize profits and minimize overheads (by serving customers as fast as they can).
 Image: Latency
How to minimize latency? To answer this, let's first look at other metrics because there is a tradeoff there.
Throughput
Just like latency, the precise meaning of throughput depends on the context.
In communication and computer networks, throughput is the rate of the message delivered successfully over a communication channel/medium. The most effective systems have maximum throughput.
When relating to the communication or network channel capacity, throughput is the maximum possible quantity of data that can be transmitted in a channel.
Taking that meaning into machine learning perspective, throughput is the number of successful requests made by the user in a given amount of time(usually seconds).
Model Size
The more the number of model parameters, the bigger the size, and the more the cost to run it.
The size of the model is usually expressed in bytes. A byte is the standard unit of memory in a computer system. 1 Kilobyte = 1024 bytes, 1024 kilobytes=1MB, 1024MB =1GB, etc...
The primary determinant of the model size is the number of parameters(weights and biases). Take an example for GPT-3. It was trained on 570GB of texts, it has 170 billion parameters taking 700GB of memory storage, and according to lambdalabs, it would require 366 years and $4.6M to train it on the lowest-priced GPU cloud on the market.
Another example: MobileNetV2 is a vision model that is designed to perform various tasks (like image recognition and object recognition) on mobile devices. It has 3.5M parameters, taking around 14MB of memory.
With that said about the model size and how it directly count to the cost, we can also talk about the computing resources that are used to train machine learning models.
There are two machine learning accelerators that are GPUs and TPUs. GPUs or Graphical Processing Units are used for training machine learning models faster. TPUs or Tensor Processing Units are also used for the same purposes but they are used for far more complex and large models and can perform fast inference on large batches of data. All of those accelerators are very good at making fast training and predictions(even with big models), but they are quite expensive.
Drawing the Line Between Model Performance and User Satisfaction Metrics
Minimizing the latency and maximizing the throughput is always going to be the first objective. But there is going to be a trade-off between them and the model size, and the cost of running it.
And this depends on the problem as well. Some users are going to appreciate having their requests met as quickly as possible, and some may appreciate getting what they asked accurately than how long it took. Take an example in disease diagnosis. The accuracy of the results is far important than the time it took to get the results.
We often increase the model size in the hope of more accuracy, and that is not a bad thing, but it's important to know that it directly affects other metrics, latency for example, because performing inference on a small model will be faster than a big model, and if you want to it to go fast, you will have to invest in expensive machine learning accelerators.
Laurence Moroney, the instructor of the course that I mentioned gave a perfect bottom line between all of those metrics.
The cost of running your ML model in production can increase sharply as your infrastructure is scaled to handle latency and throughput. This leads you to play a balancing game between costs and customer satisfaction. There's no perfect answer, and there are always trade-offs. But fortunately, there are tactics you can use to try to minimize any impact on your customer while you attempt to control cost. These may include reducing costs by sharing assets like GPUs, using multiple models to increase throughput, and perhaps even optimizing your models.......
You do want to make a trade-off between model complexity, size, accuracy, and prediction latency and understand the cost and constraints of each for the application that you're working on, and that's not an easy task. All of these factors influence your choice of the best model for your task based on your limitations and constraints.
I recommend the course to you!
Thanks for reading.
Each week, I write one article about machine learning techniques, ideas, or best practices. You can help the article reach many people by sharing it with friends or tech communities that you are a part of.
And connect with me on Twitter, and join this newsletter that I am starting to share some more ideas, what's I am working on, and notes about the latest machine learning news.
Closing on my thoughts about TensorFlow and PyTorch
